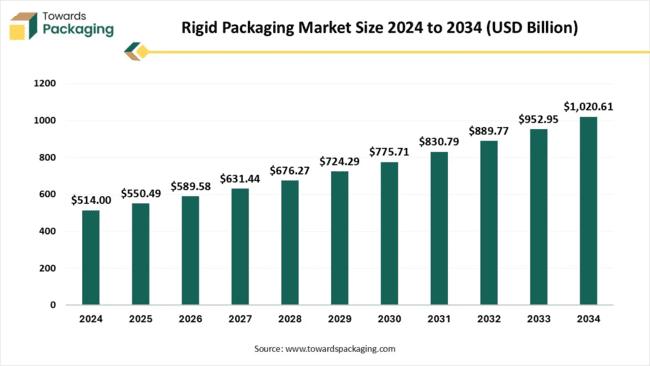
According to data published by Towards Packaging, a sister firm of Precedence Research, the global rigid packaging market will rise from USD 550.49 billion in 2025 to USD 1,020.61 billion by 2034, growing at a CAGR of 7.1%. The surge is fueled by increasing use of sustainable and innovative packaging materials, particularly in food, healthcare, and cosmetics industries, led by key players such as Amcor, Berry Plastics, and Sealed Air Corporation.
Ottawa, Nov. 07, 2025 (GLOBE NEWSWIRE) — The global rigid packaging market is projected to grow from USD 550.49 billion in 2025 to USD 1,020.61 billion by 2034, at a CAGR of 7.1%. Growth is driven by rising demand for eco-friendly, lightweight, and smart packaging solutions across industries such as food & beverages, healthcare, and cosmetics. Major players include Amcor, Berry Plastics, and Sealed Air Corporation, with strong markets in North America, Europe, and Asia Pacific.
Request Research Report Built Around Your Goals: sales@towardspackaging.com
Report Highlights: Important Revelations
- Key influences on the rigid packaging sector in Asia Pacific.
- North America’s impact on the global rigid packaging scene.
- Significance of rigid plastic packaging across different industries.
- Crucial function of rigid boxes in contemporary packaging methods.
- Wide-ranging uses of rigid packaging within the food and beverage industry
Get All the Details in Our Solutions – Access Report Sample: https://www.towardspackaging.com/download-sample/5147
The rigid packaging sector makes prominent use of plastic owing to their numerous advantages, include becoming durable, portable, chemically impermeable, and reasonably priced. Considering 31% of the world’s plastic utilisation volume going to the packaging, the industry certainly is dominating with the manner when plastics are used. Comparing to other forms of packaging, rigid packaging is more lightweight. It also reduces food waste and spoiling, protects against breakage, and offers a host of other advantages. Rigid plastic widely used in various industries such as food and beverage, personal care, healthcare and others.
Rigid packaging is often chosen since it is lightweight than components including glass or metal and consumes less electricity to transport. The carbon footprint of a product can be reduced by up to 40% by switching from glass bottles to plastic equivalents, according to recent research. This emphasises rigid plastic packaging’s sustainability, which makes it a sensible option for both producers and customers.
Rigid Packaging Market Trends
- Sustainable and Eco-Friendly Packaging: The packaging industry is shifting towards recyclable, biodegradable, and reusable materials. Companies are increasingly adopting plant-based plastics, glass, and recycled PET to reduce environmental impact.
- Smart Packaging Technologies: Integration of QR codes, IoT, and RFID technology into rigid packaging enhances customer engagement and supply chain transparency, offering real-time authentication, tracking, and product information through smart labels.
- Lightweight Packaging Solutions: Manufacturers are focusing on lightweight yet durable packaging materials to lower costs and carbon footprints, with innovations in thin-wall plastic containers and lightweight glass bottles gaining traction.
- Customization and Personalization: Advances in digital printing and 3D packaging design enable brands to create tailored packaging that resonates with consumer preferences, including limited-edition and interactive designs.
- Regulatory Compliance and Circular Economy: Governments worldwide are enforcing stricter regulations on packaging waste and sustainability, promoting circular economy principles focused on reuse and recycling of packaging materials.
- Eco-friendly and Sustainable Packaging: Due to rising concerns about global warming the demand for rigid packaging solutions that are recyclable or manufactured from recycled materials has increased. This trend is driven by consumers’ increased awareness of environmental issues, including plastic waste and pollution. Companies are investing in alternative materials like biodegradable plastics and plant-based polymers to reduce environmental impact. Packaging is being designed with reduced material usage and improved recyclability, focusing on minimalistic designs and less waste.
- Premiumization of Products: As consumers increasingly demand for higher-quality products, there is a rising trend towards premium packaging solutions. Rigid packaging, particularly glass and high-quality plastic, is utilized to convey freshness, luxury, and quality. This is particularly evident in the food and beverage sector, where glass bottles, jars, and rigid containers are being used to differentiate premium products.
- Shift from Plastic to Alternative Materials: There is a gradual shift away from single-use plastic in favour of alternative rigid packaging materials such as glass, metal, and paperboard. This trend is especially strong in consumer goods, food & beverages, and cosmetics industries. Glass is regaining popularity for its premium feel and sustainability attributes, though it remains heavy and costly compared to plastic.
- Customization and Personalization: Consumers are increasingly preferring personalized products, and packaging plays a role in this trend. Brands are focusing on offering customized packaging designs, whether through colors, shapes, or branding elements, to appeal to specific consumer groups.
North America’s Role in Global Rigid Packaging Landscape
North America is expected to grow at a significant rate over the forecast period. The robust advancements in the rigid thermoform plastic packaging industry are responsible for this region’s expansion. Numerous benefits of thermoforming include its lower cost and adaptability. The rigid thermoform plastic packaging industry has seen enormous growth in product manufacture, creating a sizable client base that is fueling the expansion of the North American rigid packaging market. The key players operating in the North America region are focused on adopting inorganic growth strategies like partnership/collaboration to develop rigid packaging, which is estimated to drive the growth of the rigid packaging market in the near future.
North America is the rigid packaging sector’s second-greatest market. North America is acknowledged as the world’s top region in packaging consumption and is home to major players in the industry, including International Paper, Tetrapak, Reynolds Group, Ball Corporation, and Owens-Illinois. In the course of the region, rigid materials are widely used in a variety of applications.
The US has the biggest market share for rigid packaging in North America. This dominance is a direct result of the nation’s substantial consumer base, advanced technology, and strong industrial infrastructure. The food and beverage, pharmaceutical, personal care, and household product industries are just a few of the diverse industries that make up the U.S. rigid packaging market.
North America’s standing as a major participant in the global rigid packaging scene is strengthened by the existence of top packaging companies, ongoing innovation, and research and development spending. Furthermore, producers in the region are compelled to implement eco-friendly practices and provide recyclable packaging solution due to strict restrictions pertaining to packaging materials and sustainability activities.
North America’s leading position in the rigid packaging market underlines how important it is to the development of industry trends and innovation in response to changing consumer needs and legal regulations.
U.S. Rigid Packaging Market Size 2025-2030 (Value – USD Billion)
| Year/Market Size | 2025 | 2026 | 2027 | 2028 | 2029 | 2030 |
| USD Billion | 140.9 | 145.5 | 150.6 | 156.2 | 162.3 | 168.9 |
U.S. Rigid Packaging Market Size By Material 2025-2030 (Value – USD Billion)
| By Material | 2025 | 2026 | 2027 | 2028 | 2029 | 2030 |
| Plastic | 49.1 | 50.0 | 51.0 | 52.1 | 53.3 | 54.6 |
| Metal | 27.3 | 28.8 | 30.3 | 32.1 | 34.0 | 36.0 |
| Paper & Paperboard | 38.7 | 39.7 | 40.9 | 42.2 | 43.6 | 45.1 |
| Glass | 20.4 | 21.3 | 22.2 | 23.2 | 24.2 | 25.4 |
| Bioplastic | 5.3 | 5.8 | 6.3 | 6.7 | 7.2 | 7.8 |
U.S. Rigid Packaging Market Size By Product Type 2025-2030 (Value – USD Billion)
| By Product Type | 2025 | 2026 | 2027 | 2028 | 2029 | 2030 |
| Boxes | 34.5 | 36.0 | 37.7 | 39.5 | 41.6 | 43.8 |
| Trays | 23.1 | 24.0 | 24.9 | 25.9 | 27.0 | 28.2 |
| Containers & Cans | 35.8 | 36.7 | 37.8 | 38.9 | 40.2 | 41.5 |
| Bottles & Jars | 38.9 | 40.1 | 41.4 | 42.8 | 44.4 | 46.1 |
| Others | 8.6 | 8.7 | 8.8 | 9.0 | 9.1 | 9.3 |
More Insights of Towards Packaging:
- Rigid Substrate Market: Smart Packaging, Sustainability, and AI Integration
- Rigid Box Market Size, Segments, and Regional Data with Competitive Analysis
- Rigid Chilled Food Packaging Market Research, Consumer Behavior, Demand and Forecast
- PET Rigid Plastic Packaging Market Dynamics, Competitive Forces and Strategic Pathways
- Rigid Sleeve Boxes Market Size, Segments, Regions, Competition & Value Chain 2025-2035
- Collapsible Rigid Containers Market Size, Share, Trends, Analysis, and Forecast 2025-2035
- Rigid Polyolefin Market Size, Competitive Analysis, Value Chain & Trade Analysis 2025-2034
- Rigid Paper Packaging Market Demand Soars in 2025, Fueled by Food, E-Commerce, and Recyclability
- Rigid IBC Market Size, Trends, Segmentation, Competitive Landscape, and Regional Outlook 2025-2035
- Rigid Food Packaging Market Size, Trends, Segmentation, Regional Outlook, and Competitive Landscape to 2035
- Rigid Bulk Packaging Market Size, Segments Data, Regional Trends, Competitive Landscape, and Key Manufacturers
- PP Rigid Plastic Packaging Market Size, Segments, Companies, Competitive Analysis, Value Chain & Trade Analysis 2025-2034
- Rigid Tray Market Size, Segments, and Regional Outlook (2025-2035), Competitive Landscape, Value Chain, and Trade Analysis
- Luxury Rigid Box Market Size, Share, Trends, Segmentation, Regional Outlook, Manufacturers, and Trade Data and Forecast 2025-2035
- Rigid Plastic Packaging Market Size, Segments, Regional Outlook (NA, EU, APAC, LA, MEA)
Sustainable Development Trends in Rigid Packaging
Berry Global Highlights Global Scale and Diversified Strength with $13 Billion in Revenue
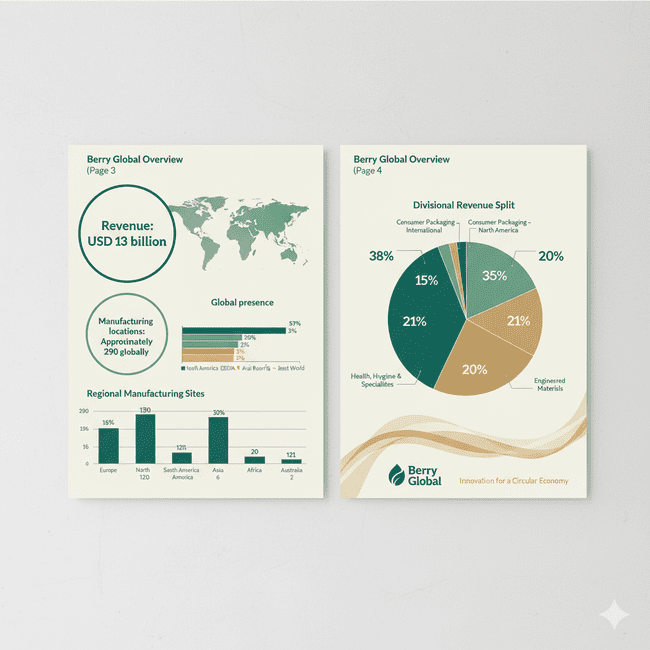
Berry Global Group, Inc. (NYSE: BERY), a leading global supplier of innovative packaging and engineered products, today released key operational and financial metrics underscoring its expansive global footprint, diversified business model, and strategic focus on key consumer and industrial end-markets.
The overview confirms the Company’s commanding position in the global packaging industry, anchored by its USD $13 billion in annual revenue and an operational network of approximately 290 manufacturing locations worldwide.
Geographic Dominance and Operational Scale
Berry Global’s global presence is strategically aligned with major consumer markets, with a clear focus on the Western hemisphere and Europe:
- Sales Concentration: North America remains the Company’s primary sales driver, accounting for a majority (57%) of net sales.
- EMEA (Europe, Middle East & Africa) represents the next largest market, contributing a substantial 35% of net sales.
- Manufacturing Footprint: The operational base is heavily concentrated in its two largest markets, with Europe hosting the highest number of sites (130) and North America close behind (121). This dual regional strength ensures robust supply chain resilience and customer proximity.
CEO Quote (Example): “Our operational footprint of nearly 290 sites is a critical competitive advantage, allowing us to serve global customers with local expertise and speed. The clear alignment between our manufacturing sites in Europe and North America and our primary revenue streams underscores a well-executed strategy focused on global scale with regional execution.”
Diversified and Balanced Divisional Strength
Berry Global maintains a highly balanced and diversified revenue profile across its four main business segments, minimizing exposure to volatility in any single market:
| Division | % of Total Revenue | Strategic Insight | |
| Consumer Packaging – International | 38 | % | The single largest division, highlighting the success of the Company’s international consumer strategy. |
| Consumer Packaging – North America | 21 | % | Core domestic strength in consumer markets. |
| Health, Hygiene & Specialties (HHS) | 21 | % | Provides stability and access to high-growth, non-cyclical end markets. |
| Engineered Materials | 20 | % | A significant, balanced contributor, serving diverse industrial and specialty markets. |
CFO Quote (Example): “The even split across our four core divisions—each contributing approximately 20% of revenue, with International Consumer Packaging providing a solid anchor at 38%—is a testament to the strength of our business model diversification. This balance ensures financial resilience and supports our investment strategy focused on Innovation for a Circular Economy.”
Berry Global continues to integrate its financial strength and global scale with its core mission to lead the industry in sustainable solutions. The Company is leveraging its vast network and deep innovation expertise to advance materials science and product designs that promote recyclability and the use of post-consumer recycled content, accelerating the transition to a net-zero economy.
About Berry Global At Berry Global Group, Inc. (NYSE: BERY), we create innovative packaging and engineered products that we believe make life better for people and the planet. We do this every day by leveraging our unmatched global capabilities, sustainability leadership, and deep innovation expertise to serve customers of all sizes around the world. Harnessing the strength in our diversity and industry-leading talent, we partner with customers to develop, design, and manufacture innovative products with an eye toward the circular economy.
Significant Reduction in Freight & GHG Emissions Achieved Through Sustainable Packaging Conversion
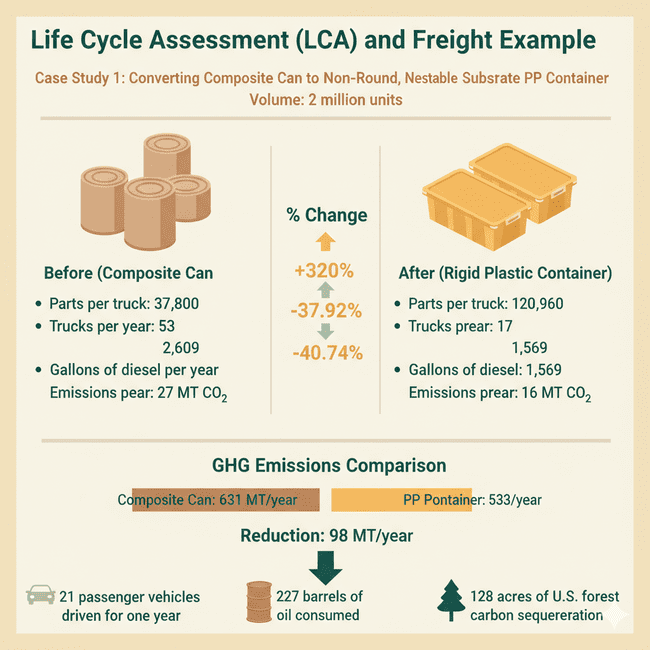
This report highlights the dramatic positive impact of converting from a composite can to a non-round, nestable, single-substrate PP (Polypropylene) container for our 2 million unit volume product. The transition has yielded a 320% increase in freight efficiency per truck, resulting in a 67.92% reduction in annual truck shipments and a total annual Greenhouse Gas (GHG) emission reduction of 98 MT. This initiative showcases a clear commitment to operational sustainability and a lower carbon footprint across the supply chain.
Key Findings & Metrics: Life Cycle Assessment (LCA) and Freight
The following data, derived from the Life Cycle Assessment (LCA) focusing on freight, demonstrates the immediate and quantifiable benefits of the packaging change.
Case Study: Composite Can to Rigid Plastic Container (Volume: 2 Million Units)
| Metric | Before (Composite Can) | After (PP Container) | % Change | Interpretation | |
| Parts per Truck | 37,800 | 120,960 | +320 | % | Massive increase in loading density due to the nestable, non-round design. |
| Trucks per Year | 53 | 17 | −67.92% | Significant reduction in logistics volume, cutting the need for more than two-thirds of annual truck trips. | |
| Gallons of Diesel per Year | 2,609 | 1,569 | −39.86% | Substantial fuel savings directly lowering operational costs and fossil fuel consumption. | |
| **Emissions per Year (MT CO₂) ** | 27 MT CO₂ | 16 MT CO₂ | −40.74% | Direct reduction in transport-related carbon emissions due to fewer trucks on the road. | |
Environmental Impact: GHG Emissions Comparison
The analysis of total annual Greenhouse Gas (GHG) emissions across the entire product lifecycle shows a significant environmental win.
- Composite Can (Before): 631 MT/year
- PP Container (After): 533 MT/year
- Total Annual Reduction: 98 MT/year
Impact Equivalencies (for Stakeholder Communication):
To put the 98 MT/year reduction into relatable terms for a broader audience, this is equivalent to:
- 21 passenger vehicles driven for one year.
- 227 barrels of oil consumed.
- The carbon sequestration of 128 acres of U.S. forest for one year.
The successful conversion to the non-round, nestable, single-substrate PP container is a testament to our commitment to both operational excellence and environmental stewardship. By prioritizing smart, space-saving design, we have not only achieved a 320% improvement in freight loading but also directly translated that efficiency into tangible environmental benefits, significantly reducing our transportation carbon footprint and overall product emissions. This project is a model for how strategic design can deliver both cost savings and a lower-impact supply chain.
Lightweighting & Nestable Design Achieves Significant Environmental and Cost Savings
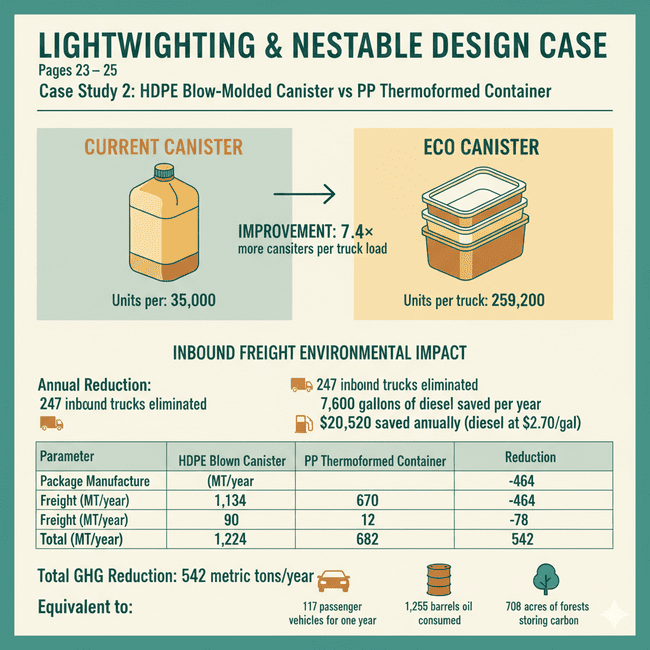
The findings of a case study demonstrating the significant environmental and economic benefits achieved by transitioning from an HDPE Blow-Molded Canister to a PP Thermoformed Container. The design focused on lightweighting and nestability for a product volume of 10 million units over a transportation distance of 200 miles.
Key Performance Improvements
The shift to the “Eco Canister” yielded substantial benefits across weight, efficiency, and sustainability:
- Weight Reduction: 34% package weight reduction.
- Logistics Improvement: 7.4× more canisters per truck load was achieved due to the nestable design (Units per truck increased from 35,000 to 259,200).
- Cubic Efficiency: Increased cubic efficiency in transportation.
- Recyclability: Improvement in end-of-life recyclability.
Inbound Freight Environmental and Economic Impact
The dramatic increase in units per truck led to major reductions in freight requirements and associated costs:
| Metric | Annual Reduction | Detail | |
| Trucks Eliminated | 247 inbound trucks | Reduced road congestion and overall logistics footprint. | |
| Diesel Savings | 7,600 gallons | Significant reduction in fossil fuel consumption. | |
| Cost Savings | $ | 20,520 | Calculated based on diesel at $2.70 per gallon. |
Emissions Comparison and Total Reduction
The project resulted in a significant reduction in annual Greenhouse Gas (GHG) emissions across both manufacturing and freight.
| Parameter | Current (HDPE Blown Canister) (MT/year) | Eco (PP Thermoformed Container) (MT/year) | Reduction (MT/year) |
| Package Manufacture | 1,134 | 670 | -464 |
| Freight | 90 | 12 | -78 |
| Total | 1,224 | 682 | 542 |
The Total GHG Reduction is 542 metric tons per year.
Equivalent Environmental Impact
The annual GHG savings are equivalent to a substantial positive environmental impact, illustrating the scale of the reduction:
- 117 passenger vehicles driven for one year.
- 1,255 barrels of oil consumed.
- 708 acres of forests storing carbon.
This information highlights the compelling business case for sustainable design changes, demonstrating how lightweighting and nestability can deliver simultaneous benefits in environmental performance, operational efficiency, and cost reduction.
Invest in Our Premium Strategic Solution: https://www.towardspackaging.com/checkout/5147
Request Research Report Built Around Your Goals: sales@towardspackaging.com
About Us
Towards Packaging is a global consulting and market intelligence firm specializing in strategic research across key packaging segments including sustainable, flexible, smart, biodegradable, and recycled packaging. We empower businesses with actionable insights, trend analysis, and data-driven strategies. Our experienced consultants use advanced research methodologies to help companies of all sizes navigate market shifts, identify growth opportunities, and stay competitive in the global packaging industry.
Stay Connected with Towards Packaging:
- Find us on Social Platforms: LinkedIn | Twitter | Instagram
- Subscribe to Our Newsletter: Towards Sustainable Packaging
- Visit Towards Packaging for In-depth Market Insights: Towards Packaging
- Read Our Printed Chronicle: Packaging Web Wire
- Get ahead of the trends – follow us for exclusive insights and industry updates:
Pinterest | Medium | Tumblr | Hashnode | Bloglovin | LinkedIn – Packaging Web Wire - Contact: APAC: +91 9356 9282 04 | Europe: +44 778 256 0738 | North America: +1 8044 4193 44
Our Trusted Data Partners
Precedence Research | Statifacts | Towards Healthcare | Towards Auto | Towards Food and Beverages | Towards Chemical and Materials | Towards Consumer Goods | Towards Dental | Towards EV Solutions | Nova One Advisor | Healthcare Webwire | Packaging Webwire | Automotive Webwire | Nutraceuticals Func Foods | Onco Quant | Sustainability Quant | Specialty Chemicals Analytics
Towards Packaging Releases Its Latest Insight – Check It Out:
- Zero Waste Packaging Market Driven by 9.65% CAGR
- Plastic Cosmetic Packaging Market Size, Share & Trends
- Sustainable Food Packaging Market Competitive Analysis
- CDMO Packaging Market Size, Segments, Share and Companies
- Thermoformed Food Packaging Trays Market Growth Rate 2034
- Shrink Packaging Market Size, Segments, Share and Companies
- Sterile Medical Packaging Market Size Driven by 11.05% CAGR
- Pharma Blister Packaging Machines Market Drives at 2.85% CAGR
- Electrostatic Discharge Packaging Market Drives at 5.15% CAGR
- Consumer Goods Packaging Market Drives at 5.44% CAGR (2025-34)
- Commercial Packaging Market Size, Segments, Share and Companies
- Snacks Packaging Market Size, Segments and Competitive Analysis
- Packaging Resin Market Size, Trends, Share, and Innovations 2034
- Volume-Optimized Corrugated Packaging Systems Market Size & Share
- U.S. 503B Compounding Pharmacy Packaging Market Size and Insights

Disclaimer: The above press release comes to you under an arrangement with GlobeNewswire. IndiaShorts takes no editorial responsibility for the same.